Activity: An Experiment with Dice
Let's throw two dice and add the scores ...
Interesting point
Many people think that one of these cubes is called "a dice". But no!
The plural is dice , but the singular is die : i.e. 1 die, 2 dice.
The common die has six faces:
We usually call the faces 1, 2, 3, 4, 5 and 6.

Throwing Two Dice and Adding the Scores ...
Example: when one die shows 2 and the other shows 6 the total score is 2 + 6 = 8
Question: Can you get a total of 8 any other way?
What about 6 + 2 = 8 (the other way around), is that a different way?
Yes! Because the two dice are different.
Example: imagine one die is colored red and the other is colored blue.
There are two possibilities for an "8":
So 2 + 6 and 6 + 2 are different.
And you can get 8 with other numbers, such as 3 + 5 = 8 and 4 + 4 = 8
High, Low, and Most Likely
Before we start, let's think about what might happen.
Question: If you throw 2 dice together and add the two scores:
- 1. What is the least possible total score?
- 2. What is the greatest possible total score?
- 3. What do you think is the most likely total score?
The first two questions are quite easy to answer:
- 1. The least possible total score must be 1 + 1 = 2
- 2. The greatest possible total score must be 6 + 6 = 12
- 3. The most likely total score is ... ???
Are they all just as likely? Or will some happen more often?
To help answer the third question let us try an experiment.
The Experiment
Throw two dice together 108 times, add the scores together each time, record the scores in a tally table.
Why 108? That seems a strange number to choose. I will explain later.
You can record the results in this table using tally marks :
Finished ...?
Now draw a bar graph to illustrate your results.
You can make your own.
Or you can use Data Graphs (Bar, Line and Pie) then print it out.
You may get something like this:
- Are the bars all about the same height?
- If not ... why not?
So Why Did We Get That Shape?
The explanation is simple:
- There is only one way to get a total of 2 (1 + 1),
- but there are six ways of getting a total of 7 (1 + 6, 2 + 5, 3 + 4, 4 + 3, 5 + 2 and 6 + 1)
Here is a table of all possible outcomes, and the totals. I have also shown what adds to 7 in bold .
You can see there is only 1 way to get 2, there are 2 ways to get 3, and so on.
Let us count the ways of getting each total and put them in a table:
Can you see the Symmetry in this table?
- 2 and 12 have the same number of ways = 1 each
- 3 and 11 have the same number of ways = 2 each
- 4 and 10 have the same number of ways = 3 each
- 5 and 9 have the same number of ways = 4 each
- 6 and 8 have the same number of ways = 5 each
OK, why 108 throws? Well, 36 throws isn't enough for good results, 360 throws is great but takes a long time. So 108 (which is 3 lots of 36) seems about right.
So let's multiply all these numbers by 3 to match our total of 108:
Those are the theoretical values, as opposed to the experimental ones you got from your experiment.
The theoretical values look like this in a bar graph:

How do these theoretical results compare with your experimental results?
This graph and your graph should be quite similar, but they are not likely to be exactly the same, as your experiment relied on chance , and the number of times you did it was fairly small.
If you did the experiment a very large number of times, you should get results much closer to the theoretical ones.
And, by the way, we've now answered the question from near the beginning of the experiment:
What is the most likely total score?
- 7 has the highest bar, so 7 is the most likely total score.
Hey, is that why people talk about Lucky 7 ... ?
Probability
On the page Probability you will find a formula:
Probability of an event happening = Number of ways it can happen Total number of outcomes
Example: Probability of a total of 2
We know there are 36 possible outcomes.
And there is only 1 way to get a total score of 2.
So the probability of getting 2 is:
Probability of a 2 = 1 36
Doing that for each score gets us:
The sum of all the probabilities is 1
For any experiment:
The sum of the probabilities of all possible outcomes is always equal to 1
Trending Resource : Thanksgiving Math Activities

Engaging Probability Games and Activities
This blog post contains Amazon affiliate links. As an Amazon Associate, I earn a small commission from qualifying purchases.
Looking for some fun ways to teach probability? Check out this collection of 9 engaging probability games and activities that are perfect for any unit on data analysis and probability.
Probability Games for the Middle School or High School Classroom
When I first started teaching, the only way I knew to review probability with my students was to give them multiple-choice questions like they would likely see on the state test at the end of the year. These questions usually revolved around weather events or selling school raffle tickets. My students were not enthused.
I decided to switch things up and have my students experience experimental probability and theoretical probability for themselves by having them participate in various probability games. These games are suitable for the middle school or high school classroom. I have even received emails from college math professors using these games with their students.
Every student will enjoy embracing the excitement of chance and challenge as they explore the important concepts of theoretical and experimental probability. My goal is to share games that are easy to play, simple to explain, and use supplies that teachers already have in their classroom such as linking cubes , a deck of cards, or dice .
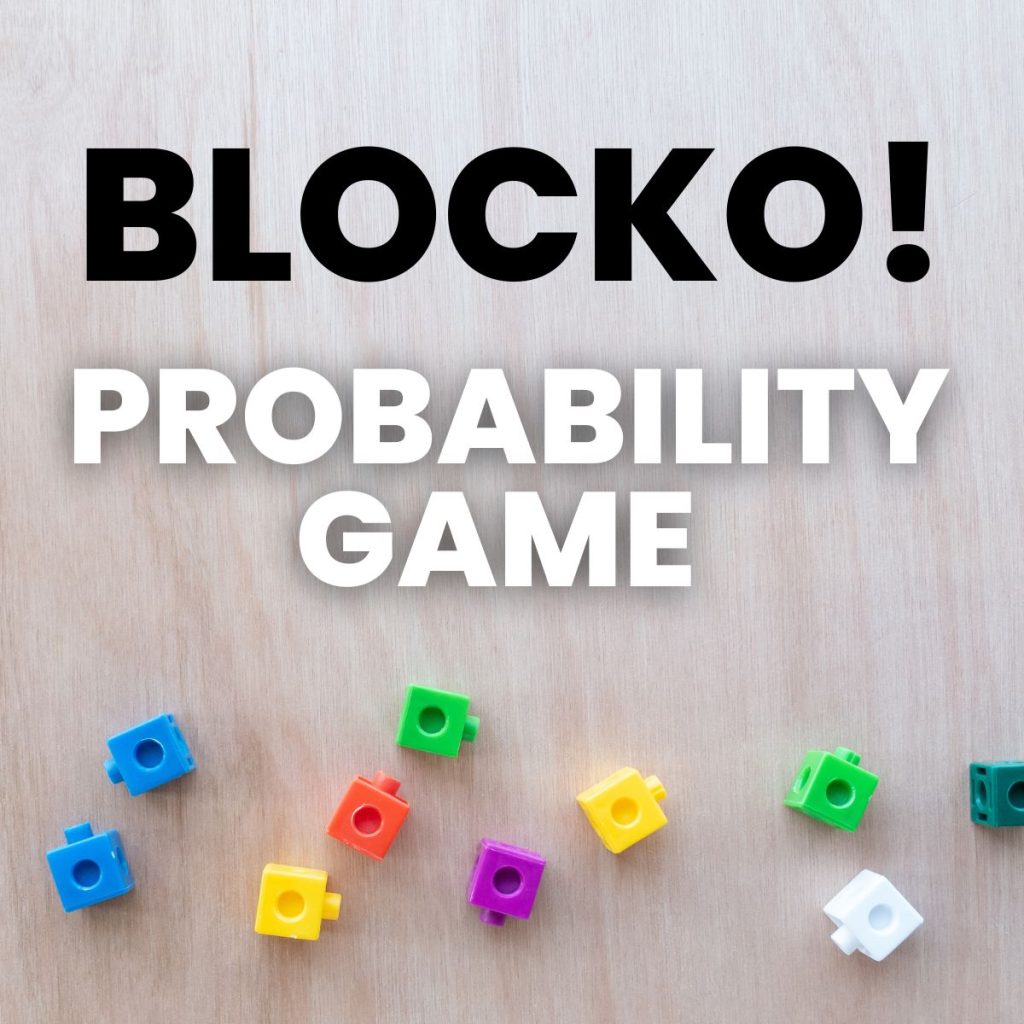
This Blocko Probability game is a fun way to introduce the difference between experimental and theoretical probability to students.
I play the game with linking cubes with my students, but you could actually use any collection of small items.
Probability Bingo
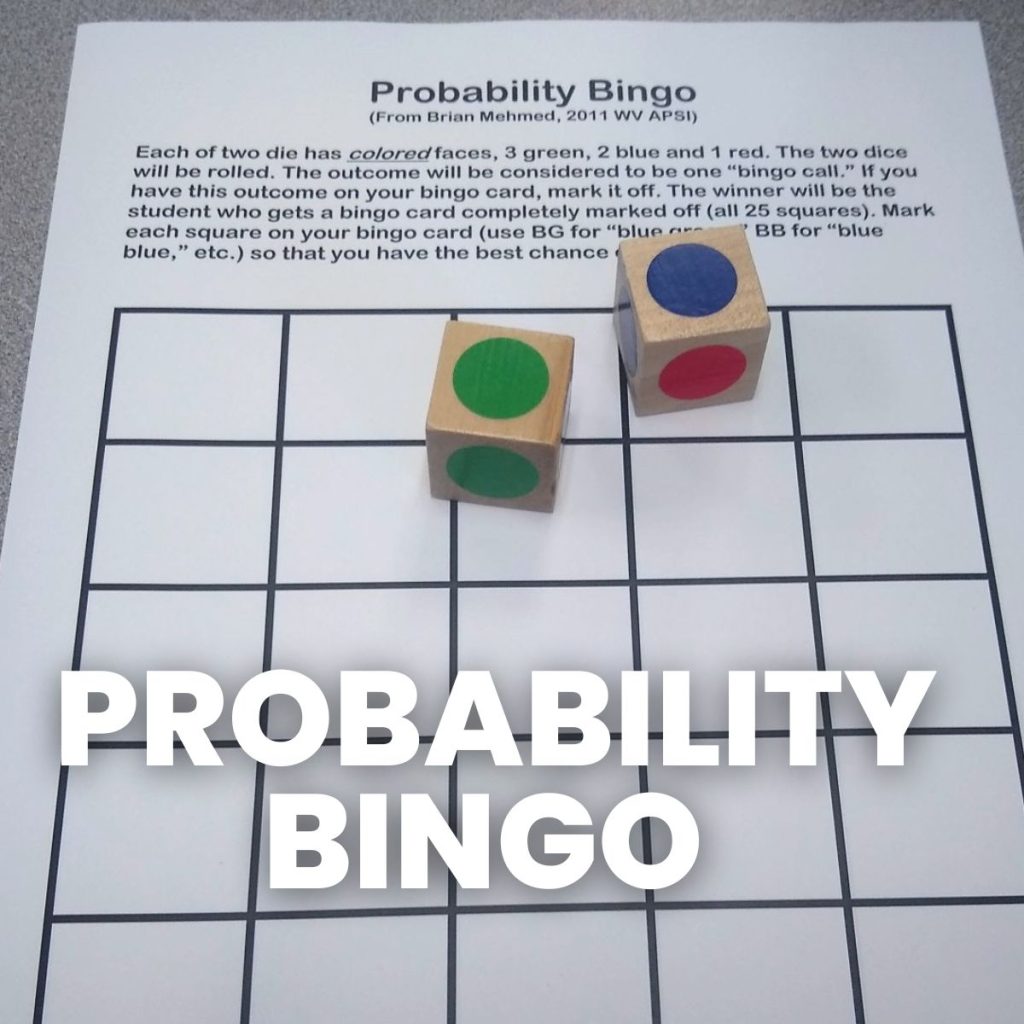
Probability Bingo is not your typical bingo game! It is designed to help students build an understanding of probability by thinking through all of the possible combinations of colors that can be rolled.
Students fill their bingo boards based on the color combinations they think will appear the most. The winner is the person who fills out their entire bingo board first.
Greedy Pig Dice Game
I have been playing this greedy pig dice game with my students to practice probability since I learned it while student teaching!
All you need for this game is a set of dice !
Teaching Probability with Deal or No Deal
Students will enjoy calculating probabilities while playing through a game of Deal or No Deal ! So many different probability concepts can be discussed while you work through a simulation of the popular tv game show.
There are many other game shows that you could pull ideas from for other probability-based lessons.
Left Center Right Game

There is so much probability to explore with the Left Center Right Dice game . I love playing a few rounds of Left Center Right to kick off my probability units!
Probability Exploration Activities
When it comes to teaching probability, hands-on activities are the secret ingredient to making math lessons memorable and impactful. In this section, we’ll delve into a variety of engaging probability activities that you can seamlessly integrate into your middle or high school math curriculum.
These probability activities use easy-to-find supplies such as linking cubes , hex nuts, rope, and cardstock .
Mystery Box Probability Activity
Can your students use their knowledge of probability to determine the contents of the mystery box using the relative frequency of the colors?
Hex Nut Probability Activity
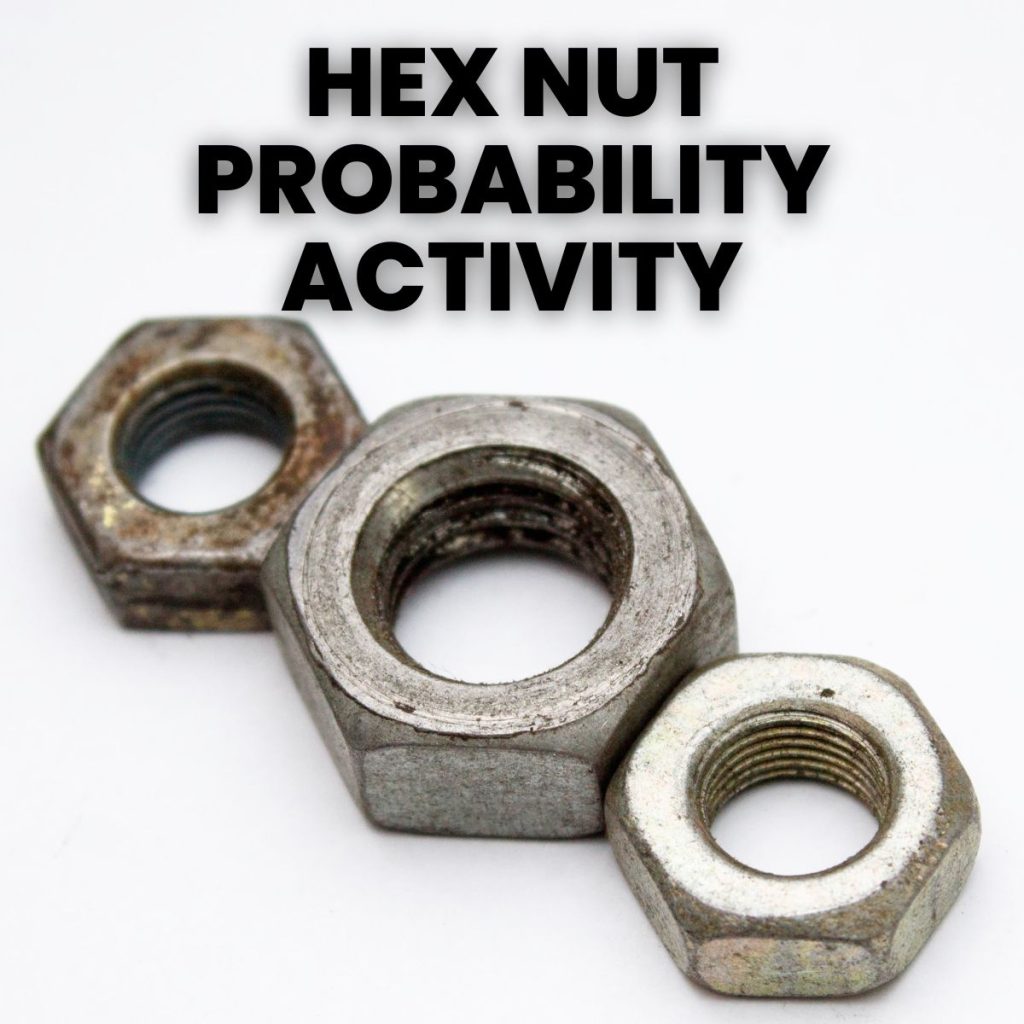
All you need for this fun and engaging hex nut probability activity are hex nuts, empty soda bottles, and a plastic ring.
Probability with Cuboctahedrons

Your students will enjoy building cuboctahedrons and using them to explore a fun probability question!

Marriage Probability Activity
My high school students really enjoyed exploring the probability behind an old fable regarding the likelihood of getting married in the next year.
Sarah Carter teaches high school math in her hometown of Coweta, Oklahoma. She currently teaches AP Precalculus, AP Calculus AB, and Statistics. She is passionate about sharing creative and hands-on teaching ideas with math teachers around the world through her blog, Math = Love.
Similar Posts
Real Number System Activities
Mmm Exponent Task and Card Sort Activity
Mathematical Magic Trick
Fraction War Card Game
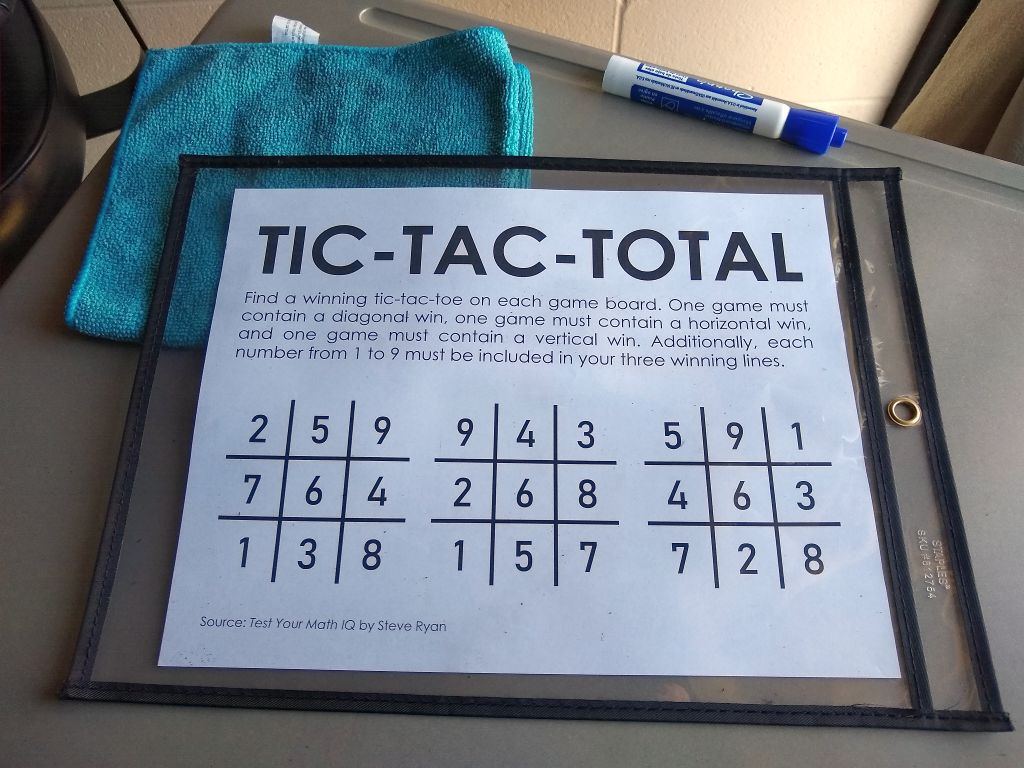
Tic Tac Total Puzzle

Puzzle of the Week Poster

Experimental Probability
Experimental probability: introduction, experimental probability: definition, experimental probability formula, solved examples, practice problems, frequently asked questions.
In mathematics, probability refers to the chance of occurrence of a specific event. Probability can be measured on a scale from 0 to 1. The probability is 0 for an impossible event. The probability is 1 if the occurrence of the event is certain.
There are two approaches to study probability: experimental and theoretical.
Suppose you and your friend toss a coin to decide who gets the first turn to ride a new bicycle. You choose “heads” and your friend chooses “tails.”
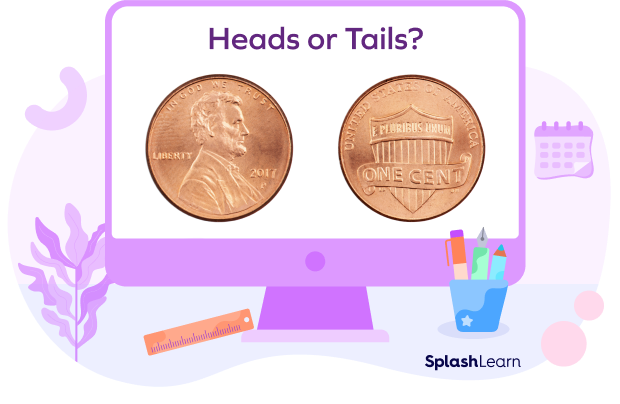
Can you guess who will win? No! You have $\frac{1}{2}$ a chance of winning and so does your friend. This is theoretical since you are predicting the outcome based on what is expected to happen and not on the basis of outcomes of an experiment.
So, what is the experimental probability? Experimental probability is calculated by repeating an experiment and observing the outcomes. Let’s understand this a little better.
Recommended Games

Experimental probability, or empirical probability, is the probability calculated by performing actual experiments and gathering or recording the necessary information. How would you define an experiment? The math definition of an experiment is “a process or procedure that can be repeated and that has a set of well-defined possible results or outcomes.”

Consider the same example. Suppose you flip the coin 50 times to see whether you get heads or tails, and you record the outcomes. Suppose you get heads 20 times and tails 30 times. Then the probability calculated using these outcomes is experimental probability. Here, t he experimental meaning is connected with such experiments used to determine the probability of an event.
Now that you know the meaning of experimental probability, let’s understand its formula.
Experimental Probability for an Event A can be calculated as follows:
P(E) $= \frac{Number of occurance of the event A}{Total number of trials}$
Let’s understand this with the help of the last example.
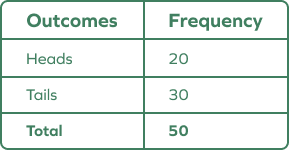
A coin is flipped a total of 50 times. Heads appeared 20 times. Now, what is the experimental probability of getting heads?
E xperimental probability of getting heads $= \frac{Number of occurrences}{Total number of trials}$
P (Heads) $= \frac{20}{50} = \frac{2}{5}$
P (Tails) $= \frac{30}{50} = \frac{3}{5}$
Experimental Probability vs. Theoretical Probability
Theoretical probability expresses what is expected. On the other hand, experimental probability explains how frequently an event occurred in an experiment.
If you roll a die, the theoretical probability of getting any particular number, say 3, is $\frac{1}{6}$.
However, if you roll the die 100 times and record how many times 3 appears on top, say 65 times, then the experimental probability of getting 3 is $\frac{65}{100}$.
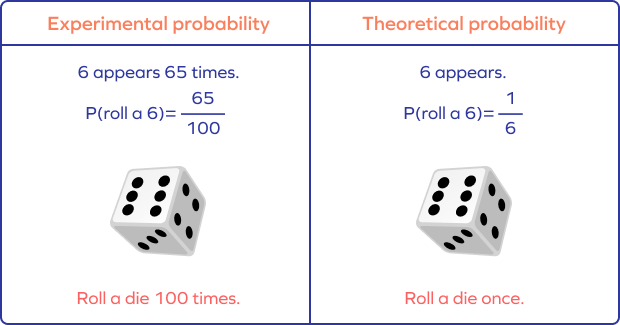
Theoretical probability for Event A can be calculated as follows:
P(A) $= \frac{Number of outcomes favorable to Event A}{Number of possible outcomes}$
In the example of flipping a coin, the theoretical probability of the occurrence of heads (or tails) on tossing a coin is
P(H) $= \frac{1}{2}$ and P(T) $= \frac{1}{2}$ (since possible outcomes are $2 -$ head or tail)
Experimental Probability: Examples
Let’s take a look at some of the examples of experimental probability .
Example 1: Ben tried to toss a ping-pong ball in a cup using 10 trials, out of which he succeeded 4 times.

P(win) $= \frac{Number of success}{Number of trials}$
$= \frac{4}{10}$
$= \frac{2}{5}$
Example 2: Two students are playing a game of die. They want to know how many times they land on 2 on the dice if the die is rolled 20 times in a row.

The experimental probability of rolling a 2
$= \frac{Number of times 2 appeared}{Number of trials}$
$= \frac{5}{20}$
$= \frac{1}{4}$
1. Probability of an event always lies between 0 and 1.
2. You can also express the probability as a decimal and a percentage.
Experimental probability is a probability that is determined by the results of a series of experiments. Learn more such interesting concepts at SplashLearn .
1. Leo tosses a coin 25 times and observes that the “head” appears 10 times. What is the experimental probability of getting a head?
P(Head) $= \frac{Number of times heads appeared}{Total number of trials}$
$= \frac{10}{25}$
$= \frac{2}{5}$
$= 0.4$
2. The number of cakes a baker makes per day in a week is given as 7, 8, 6, 10, 2, 8, 3. What is the probability that the baker makes less than 6 cakes the next day?
Solution:
Number of cakes baked each day in a week $= 7, 8, 6, 10, 2, 8, 3$
Out of 7 days, there were 2 days (highlighted in bold) on which the baker made less than 6 cookies.
P$(< 6 $cookies$) = \frac{2}{7}$
3. The chart below shows the number of times a number was shown on the face of a tossed die. What was the probability of getting a 3 in this experiment?
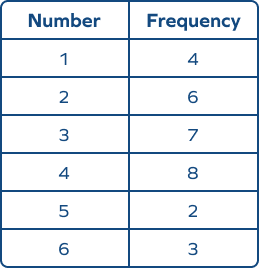
Number of times 3 showed $= 7$
Number of tosses $= 30$
P(3) $= \frac{7}{30}$
4. John kicked a ball 20 times. He kicked 16 field goals and missed 4 times . What is the experimental probability that John will kick a field goal during the game?
Solution:
John succeeded in kicking 16 field goals. He attempted to kick a field goal 20 times.
So, the number of trials $= 20$
John’s experimental probability of kicking a field goal $= \frac{Successful outcomes} {Trials attempted} = \frac{16}{20}$
$= \frac{4}{5}$
$= 0.8$ or $80%$
5. James recorded the color of bikes crossing his street. Of the 500 bikes, 10 were custom colors, 100 were white, 50 were red, 120 were black, 100 were silver, 60 were blue, and 60 were gray. What is the probability that the car crossing his street is white?
Number of white bikes $= 100$
Total number of bikes $= 500$
P(white bike) $= \frac{100}{500} = \frac{1}{5}$
Attend this quiz & Test your knowledge.
In a class, a student is chosen randomly in five trials to participate in 5 different events. Out of chosen students, 3 were girls and 2 were boys. What is the experimental probability of choosing a boy in the next event?
A manufacturer makes 1000 tablets every month. after inspecting 100 tablets, the manufacturer found that 30 tablets were defective. what is the probability that you will buy a defective tablet, the 3 coins are tossed 1000 times simultaneously and we get three tails $= 160$, two tails $= 260$, one tail $= 320$, no tails $= 260$. what is the probability of occurrence of two tails, the table below shows the colors of shirts sold in a clothing store on a particular day and their respective frequencies. use the table to answer the questions that follow. what is the probability of selling a blue shirt.

Jason leaves for work at the same time each day. Over a period of 327 working days, on his way to work, he had to wait for a train at the railway crossing for 68 days. What is the experimental probability that Jason has to wait for a train on his way to work?
What is the importance of experimental probability?
Experimental probability is widely used in research and experiments in various fields, such as medicine, social sciences, investing, and weather forecasting.
Is experimental probability always accurate?
Predictions based on experimental probability are less reliable than those based on theoretical probability.
Can experimental probability change every time the experiment is performed?
Since the experimental probability is based on the actual results of an experiment, it can change when the results of an experiment change.
What is theoretical probability?
The theoretical probability is calculated by finding the ratio of the number of favorable outcomes to the total number of probable outcomes.
RELATED POSTS
- Length Conversion – Metric and Customary System, Examples
- How Many Weeks Are There in a Month? Definition with Examples
- Analog Clock – Definition, Clock Face, Clock Hands, Examples, Facts
- Slope of Parallel Line: Formula, Derivation, Example
- Milliliter – Definition with Examples

Math & ELA | PreK To Grade 5
Kids see fun., you see real learning outcomes..
Make study-time fun with 14,000+ games & activities, 450+ lesson plans, and more—free forever.
Parents, Try for Free Teachers, Use for Free

IMAGES
VIDEO